Working with the SSA3000X Peak Table
March 22, 2018
The SIGLENT SSA3000X series of spectrum analyzers include a peak table that can be used to easily separate important signals based on their amplitude values. In this operating tip, we will show how to set the instrument to define peak signals and display them in a clear tabular format.
For the purpose of this tip, we’ll input an unknown signal.
We could use individual markers and then assign each marker to a “peak” value by pressing Marker > Select the marker number > Set the type to Normal, Select the trace, and then scroll the marker to the top of a signal as shown:
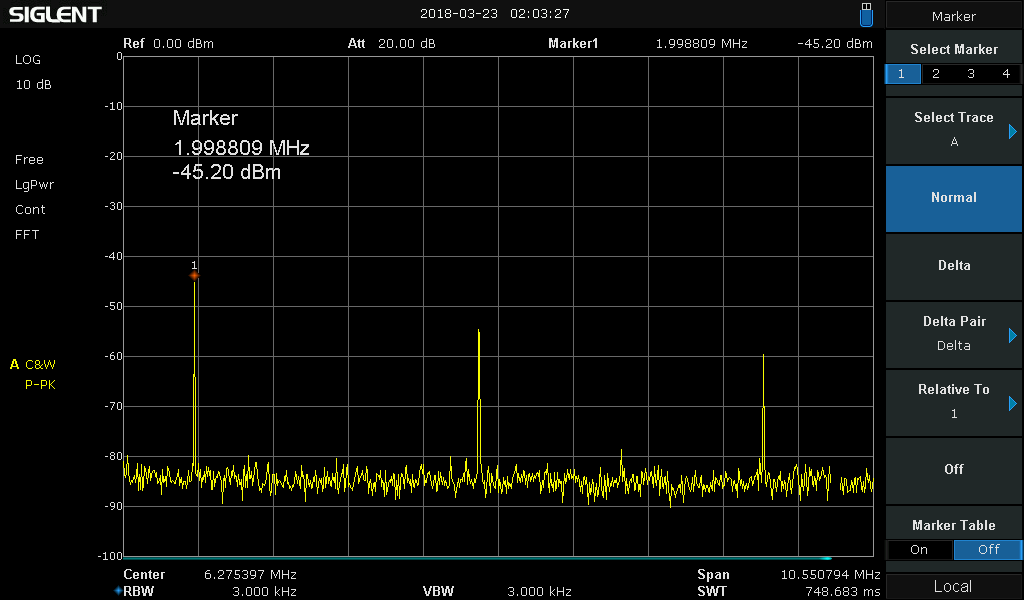
As you can see, there is now a marker at 1.998809 MHz with an amplitude of -45.20 dBm.
This is a great way to find the frequency and amplitude of one or two points on a spectrum, but it can be tedious when trying to find numerous point values at one time.
A Peak Table is a much more efficient method of finding multiple peak values.
It automatically lists up-to 16 peaks (maximum signals that exceed the set peak threshold) and their frequencies as shown:
Setup:
- Configure the instrument span, RBW, and other settings to frame the frequencies of interest
- Press Peak on the front panel
- Set Peak table = ON
- Adjust the threshold by pressing Search Config and changing the peak threshold. Any local maxima (peak) that exceed the Peak Threshold will be designated as a peak and listed in the table.
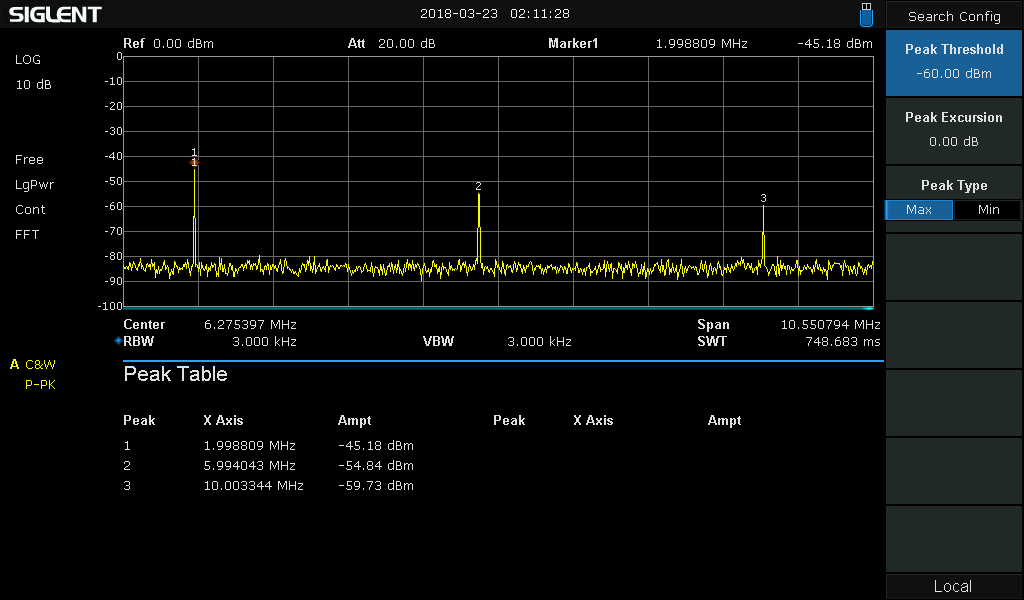
- In this example, we set the peak excursion to 0 dBm (preferred setting) and then adjust the peak threshold:
Here, the peak threshold is set to -60 dBm, and three peaks are shown (2 MHz/-45 dBm, 6 MHz/-54 dBm, and 10 MHz/-60 dBm):
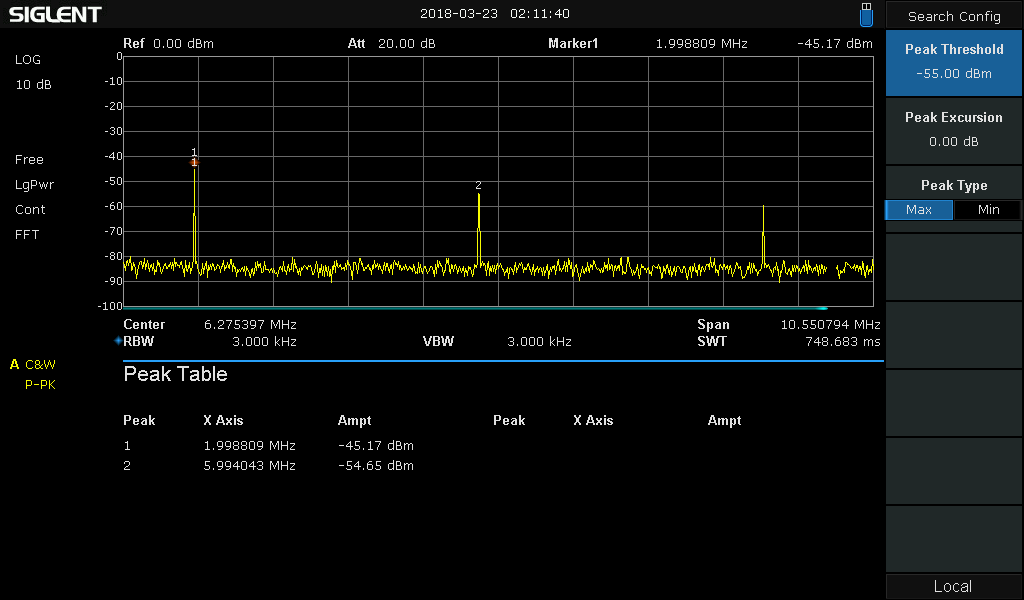
If we change the threshold to -55 dBm, then we lose a peak:
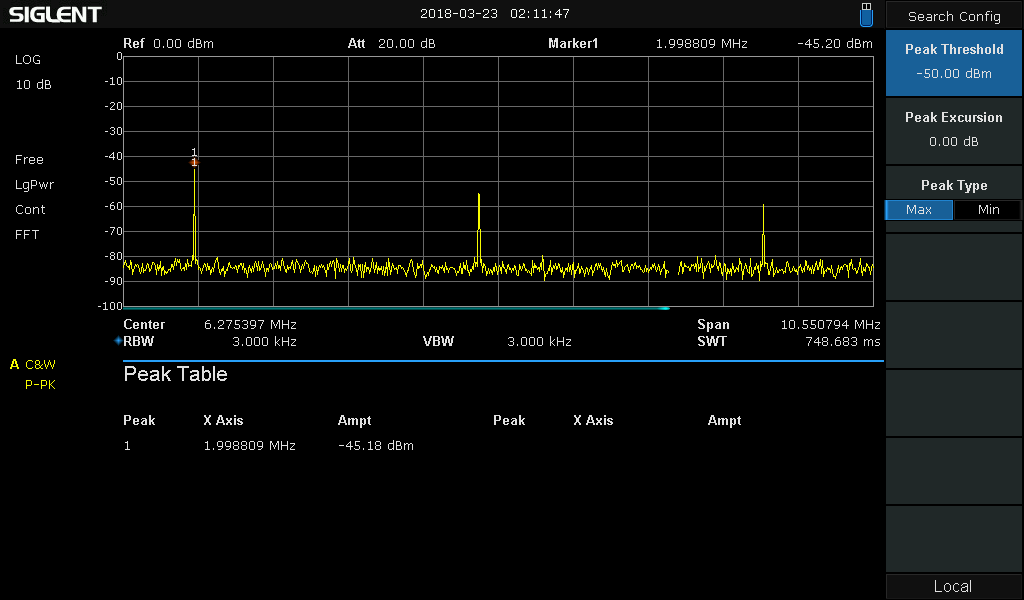
Finally, if we change the threshold to -50 dBm, we lose another peak: