Getting Started with EasySpectrum Software
October 23, 2017
EasySpectrum software provides a remote control interface for SIGLENT SSA3000 Series of spectrum analyzers that can be used to ease data collection, remote monitoring, and pre-compliance test sequencing.
The software consists of two basic control modes:
Monitor
A virtual front panel mode that enables users to see the spectral traces in real time as well as control the instruments basic settings like start/stop frequency and resolution bandwidth.
This mode is ideal for remote monitoring transmitters, site surveys of interference sources, and collection of multiple data sets.
EMI
Provides test sequence creation, correction tables, limit line editing, peak detection controls, and final scan results reporting.
This mode is useful for pre-compliance and electromagnetic interference testing.
INITIAL SETUP
– SSA3000X Series spectrum analyzer
– Download the latest VISA Runtime Engine that is compatible with your computer operating system.
It can be downloaded from National Instruments: http://bit.ly/2pw5gQW
– Download EasySpectrum Software from the SSA3000X Product Page on the SIGLENT America website:
http://bit.ly/2okc8wG
– Compatible computer running Win7 through Win10
– LAN or USB connection to SSA3000X
– Power on analyzer and connect the instrument to the computer using the USB or LAN cable. Note that the USB and LAN communication ports are located on the back panel of the analyzer. In this example, we will use the USB connection.
– Start EasySpectrum by double-clicking on the EasySpectrum icon on the desktop or by running it from the start menu

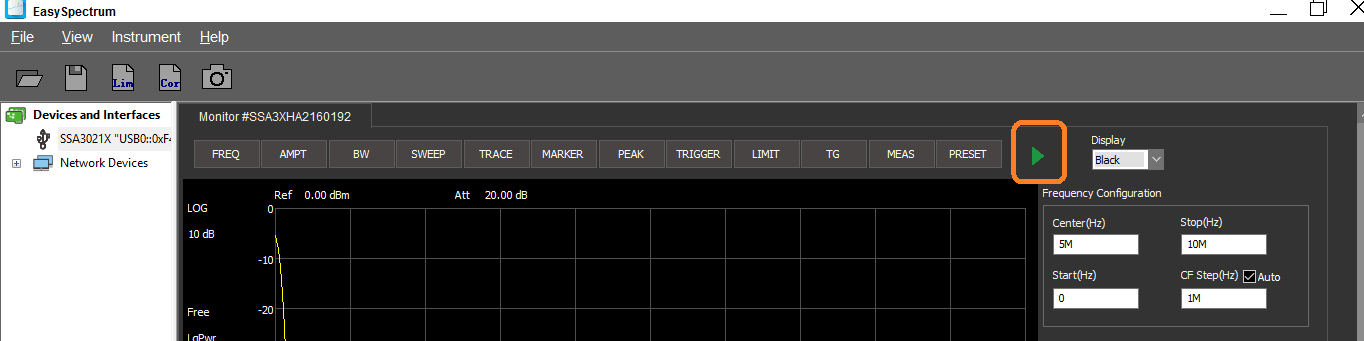
– If the connection is successful, you should see the instrument address appear under the Devices and Interfaces heading as shown below:

MONITOR MODE
The monitor mode is designed to ease remote observation and spectral data collection from broadcast, transmitters, and interference sources.
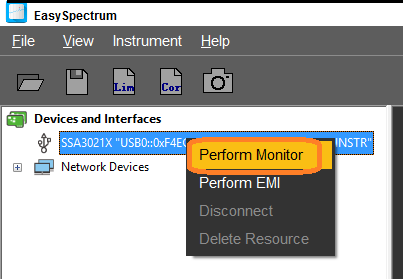
1. To begin, right-click on the instrument you wish to control under the Devices and Interfaces entry and select Perform Monitor:
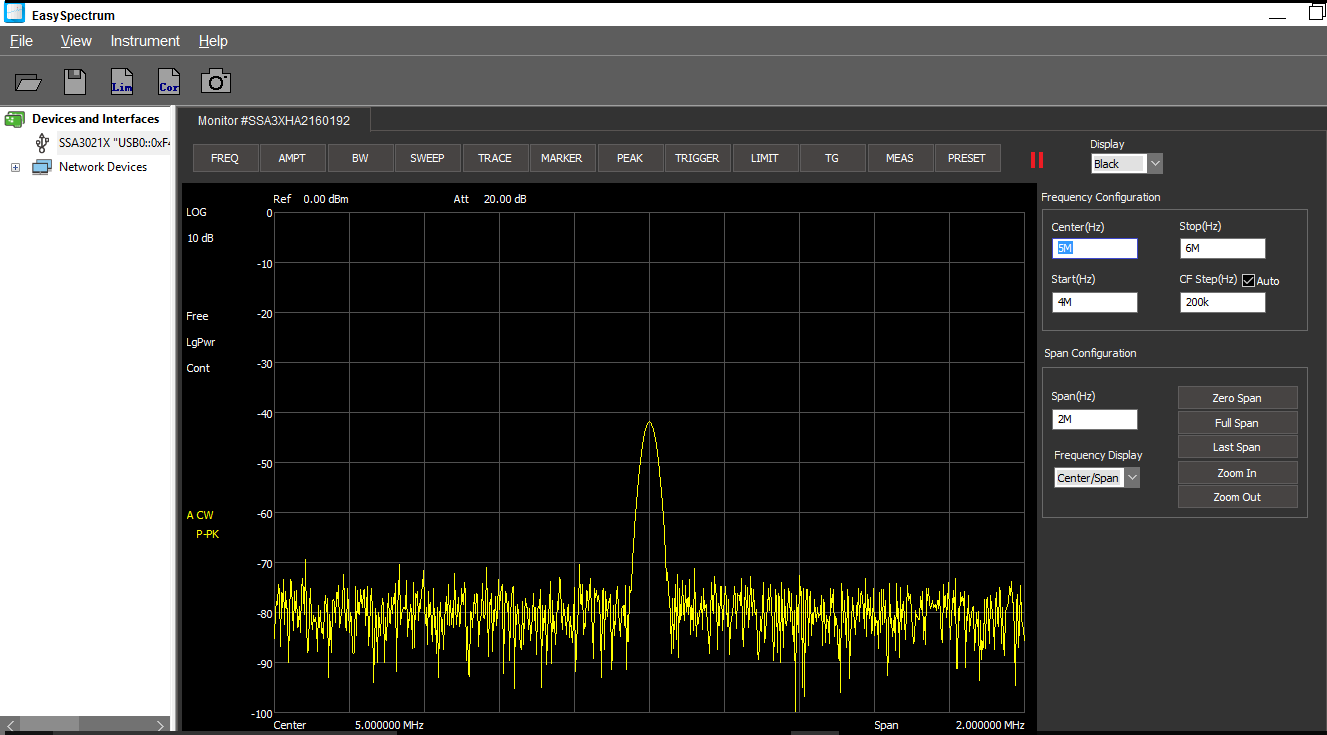
2. This will open the monitor window, as shown below:
3. The menu bar along the top contains controls that can alter the settings on the instrument. Here is a brief summary of each:
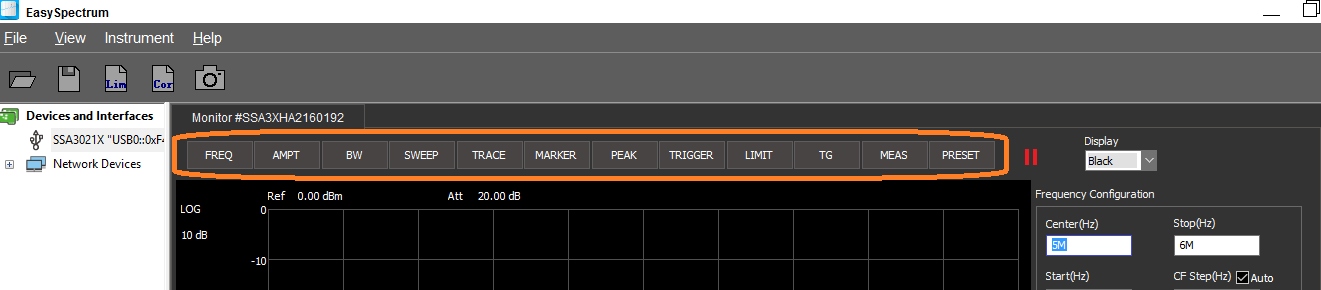
FREQ: Set the start, stop, center and other frequency and span parameters
AMPT: Set the analyzer amplitude parameters, including the pre-amplifier, attenuation, vertical measurement scale, and correction settings
BW: Set the Resolution Bandwidth (RBW), Video Bandwidth (VBW), and filter settings. Smaller bandwidths increase frequency resolution and decrease the noise floor, but increase sweep time
SWEEP: Set the sweep time, single/continuous, and the sweep rule
TRACE: Enable/disable traces, set trace type, detector type, and trace math
MARKER: Select marker number, type, and position
PEAK: Set peak type, threshold, and excursion as well as enable/disable peak table
TRIGGER: Set the trigger mode and trigger level for externally triggered sweeps
LIMIT: Enable/Disable limit lines, create/edit limit line segments/points, and enable/disable limit testing
TG (OPTIONAL LICENSE): Enable/Disable the tracking generator output, set output amplitude, and normalization of the set trace (Part Number TG-SSA3000X)
MEAS (OPTIONAL): Enable/Disable on screen measurements, including Channel Power, ACPR, Occupied BW, T-Power, TOI, and Spectrum Monitor. (Part Number AMK-SSA3000X)
PRESET: Recall the instrument configuration that is currently mapped to the Preset key on the instrument front panel
4. Run/Pause to start/stop trace updating:
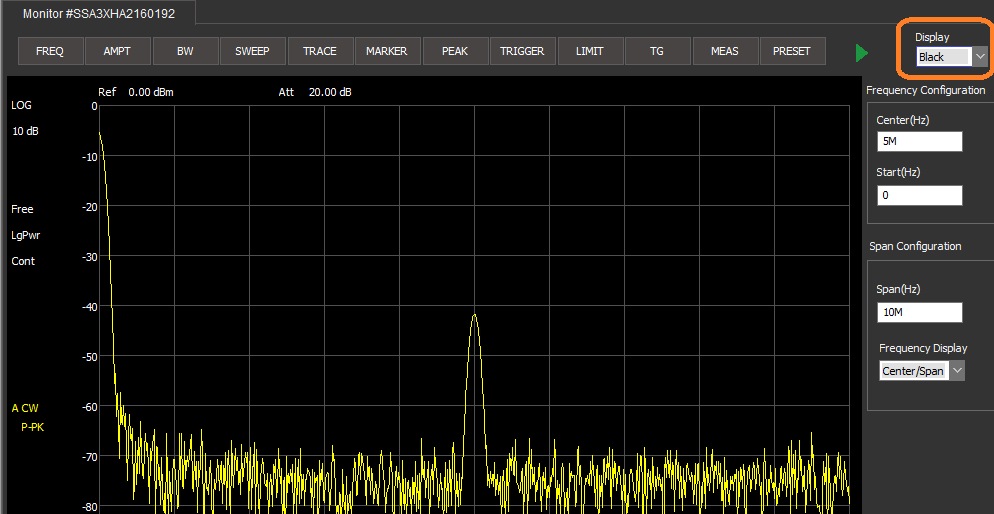
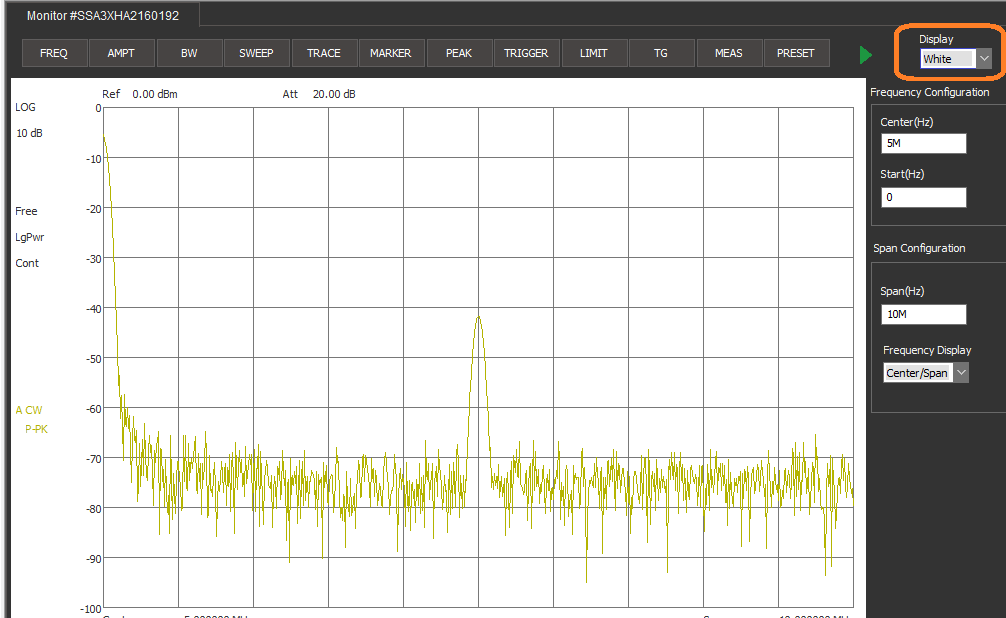
5. Set the display color using the Display setting:
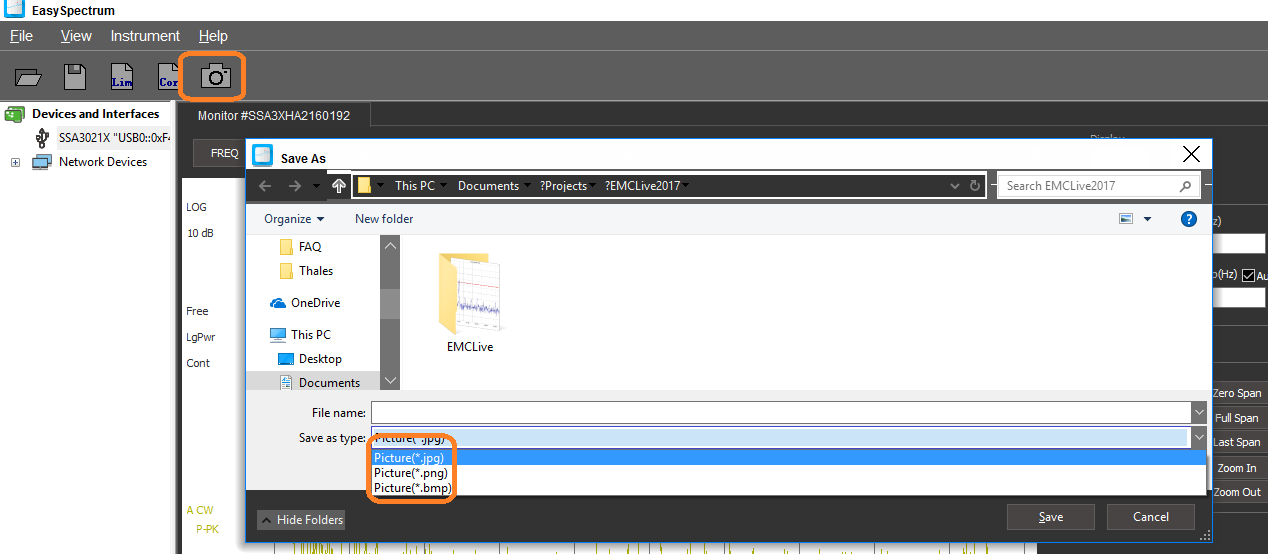
6. To capture screen images, press the Camera icon:
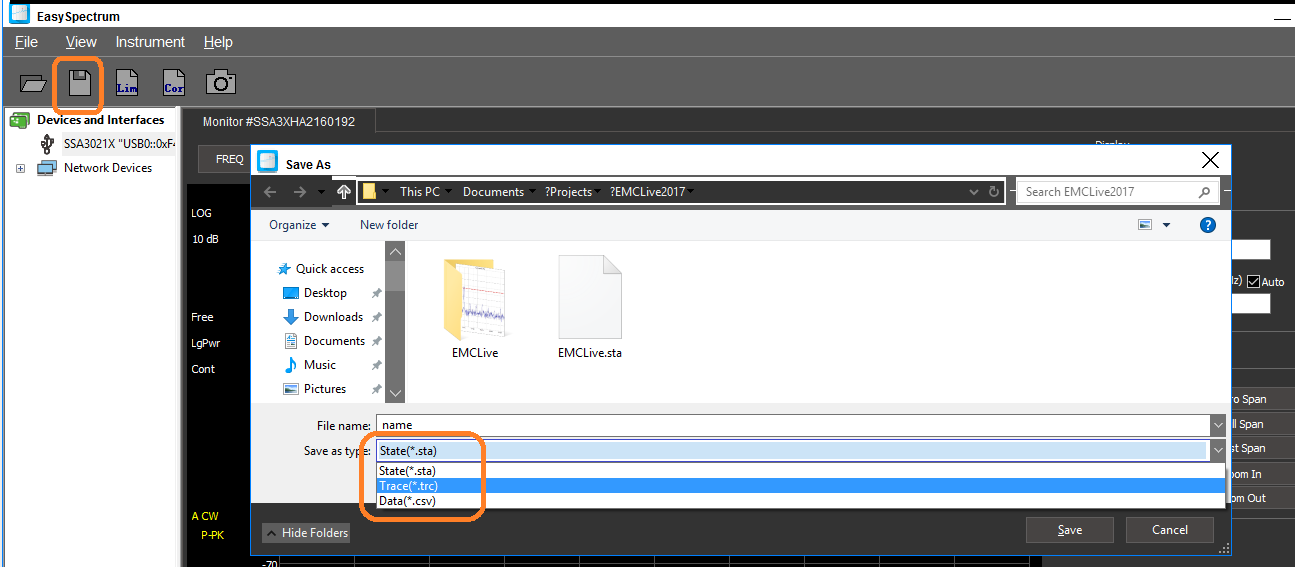
7. To save setups and trace data (*.CSV format), select the Save icon:
EMI MODE
The EMI mode is designed to ease test sequence creation for electro-magnetic (EM) pre-compliance testing, including radiated and conducted emissions testing.
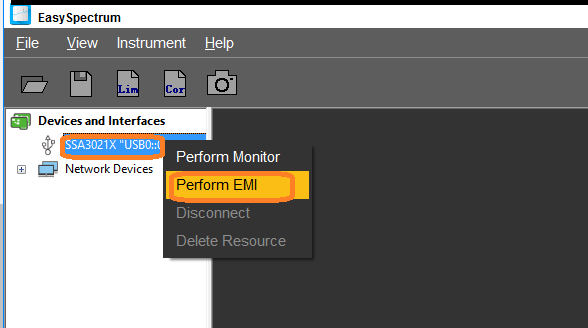
1. To begin, right-click on the instrument you wish to control under the Devices and Interfaces entry and select Perform EMI:
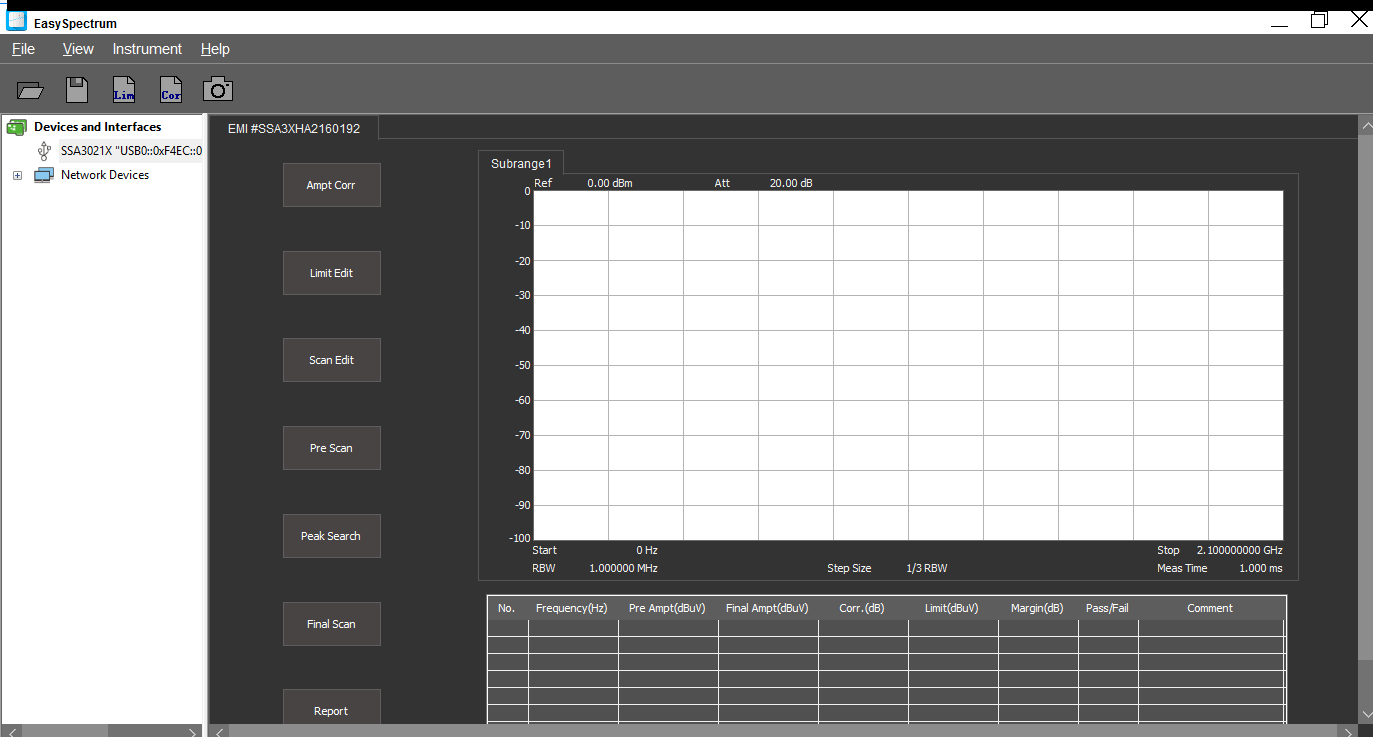
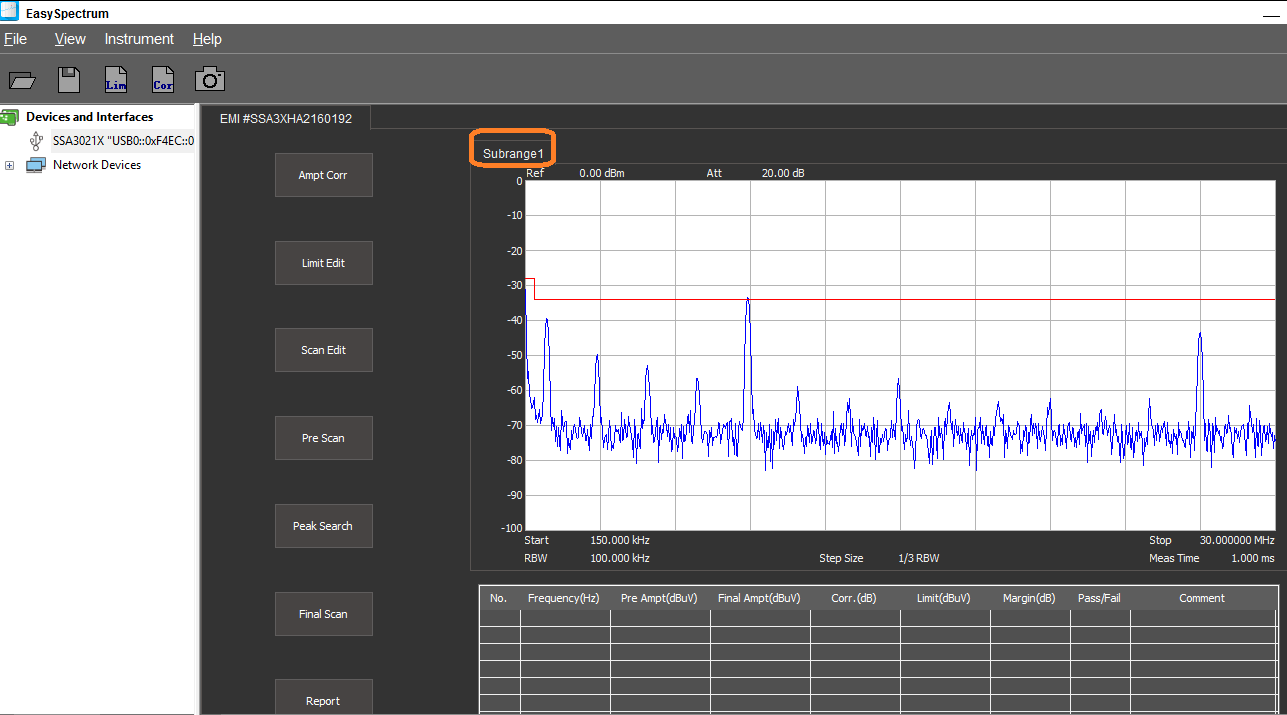
2. This will open the EMI window, as shown below:
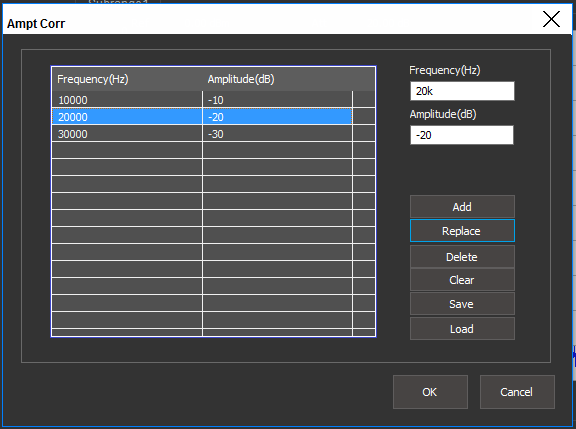
3. Ampt Corr: Amplitude correction can be activated to mathematically adjust the collected data to account for cable/adapter losses as well as antenna gain factors.
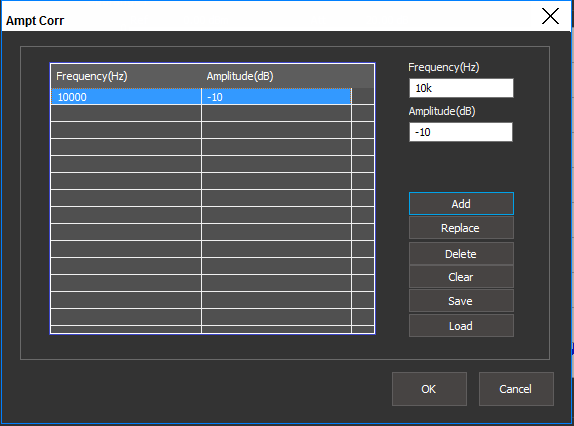
– You can add a new correction point by entering the frequency and amplitude values and press Add. Each press of Add will place another point in the list.
NOTE: You can use units (k = Kilo/10+3, M = Mega/10+6, G = Giga/10+9) in the appropriate textboxes to make parameter entry more convenient.
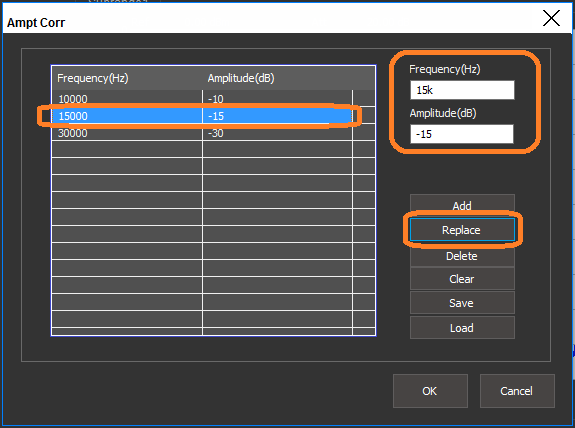
– You can replace any point in the list by mousing over the appropriate cell and left click to highlight. Then, enter the correct frequency and amplitude values, and press Replace to overwrite the value as shown below:
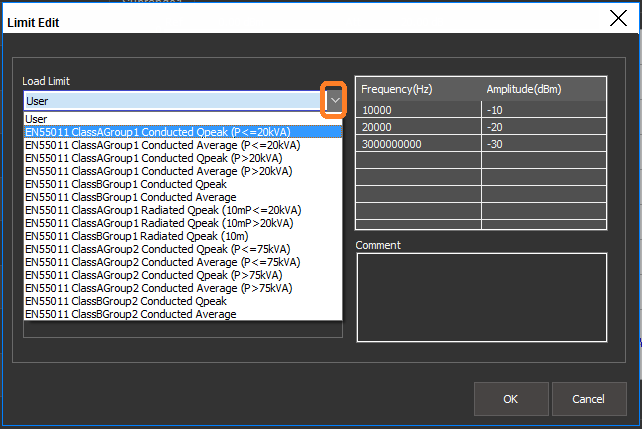
4. Limit Edit: Limit lines clearly delineate the passing and failing values of a test specification. Traces that have elements that are near or exceed the limit line values are considered to be failed peaks in a scan.
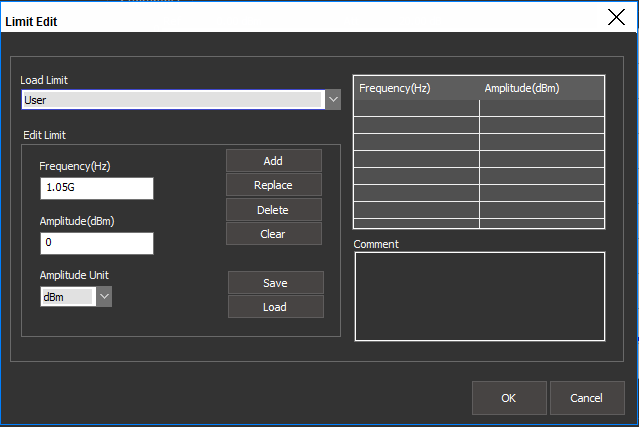
– You can add a new correction point by entering the frequency and amplitude values and press Add. Each press of Add will place another point in the list.
NOTE: You can use units (k = Kilo/10+3, M = Mega/10+6, G = Giga/10+9) in the appropriate textboxes to make parameter entry more convenient.
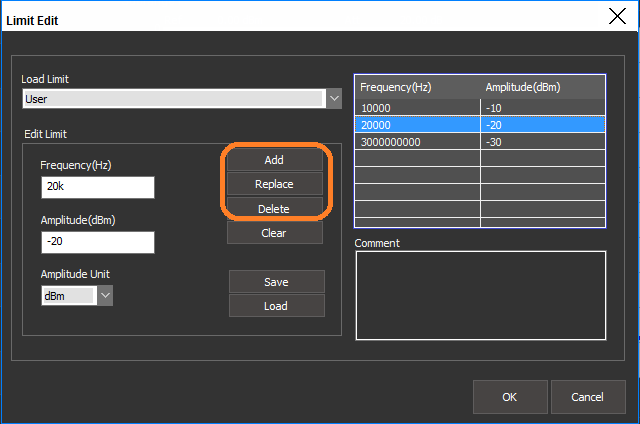
– You can replace any point in the list by mousing over the appropriate cell and left click to highlight. Then, enter the correct frequency and amplitude values, and press Replace to overwrite the value.
There are also a number of pre-defined load limits located under the drop down labeled Load Limits:
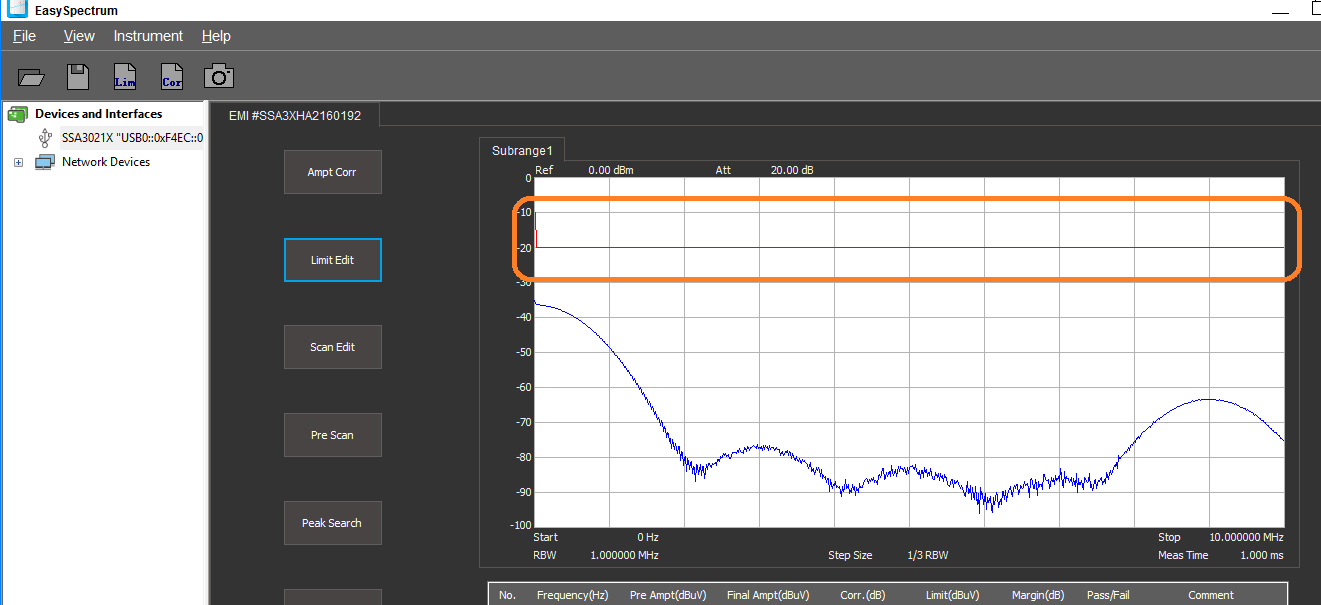
– The limit line will appear in red on the main window:
5. Scan Edit: Configure the scan which is broken up into three distinct parts. While they can be configured in many different ways, here are oursuggested settings for preliminary scans:
NOTE: The input to any spectrum analyzer is very sensitive to input voltage/powers and transients. If you are unsure of the potential signal amplitude, protect the analyzer RF input by placing fixed attenuation and transient limiters in series with the device-under-test. 10dB may be a good starting point until you are sure that the maximum input is safe.
– Pre-scan setup: The pre-scan setup configures the instrument for the initial sweep on the DUT. It is initiated after pressing the Pre-Scan button.
Set Scan Start and Stop to encompass the full test frequency range. For example, if you expect to perform a conducted emissions test, set the start frequency as 150k and the stop as 30M as prescribed in the FCC subpart 15 specifications.
Set Pre-Detect to Positive Peak (Pos Peak) for the initial scan. The Positive Peak detector is recommended for this scan because it provides the “worst case” highest valued measurement for each step in the sweep.
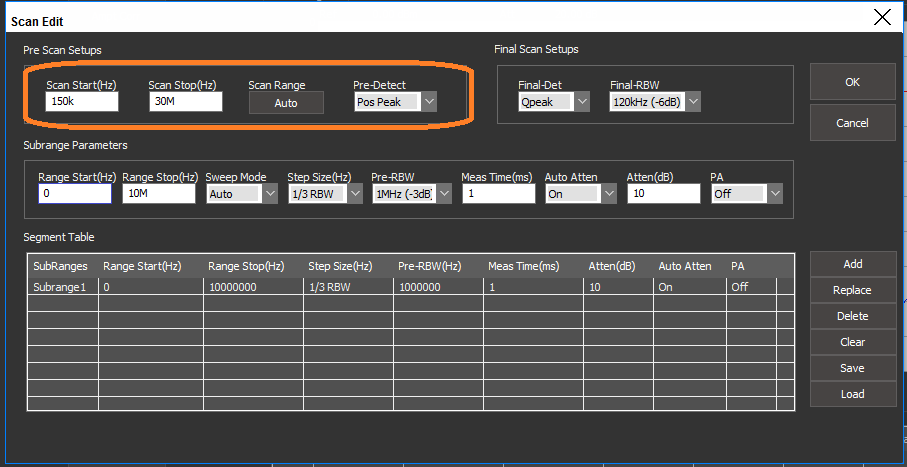
– Subrange Parameters: You can break the main scan into smaller subparts. This will provide higher frequency resolution, but will increase the test time.
For the first scans on a DUT, a single scan consisting of one segment will quickly provide more details into the EM output. If you have peaks that are close (>3dB from the limit line), it may be worthwhile to re-run the test using more segments over the same span. This will provide finer frequency resolution and may help to isolate the root cause of the EM signals.
It is recommended to keep the Sweep mode and Auto Atten (attenuator) = AUTO.
Step size = 1/3 RBW or 1/10 RBW. 1/3 setting will be faster. 1/10 with provide higher frequency resolution.
To accept the setup, press OK.
To Run a Pre-Scan, press Pre Scan in the main window.
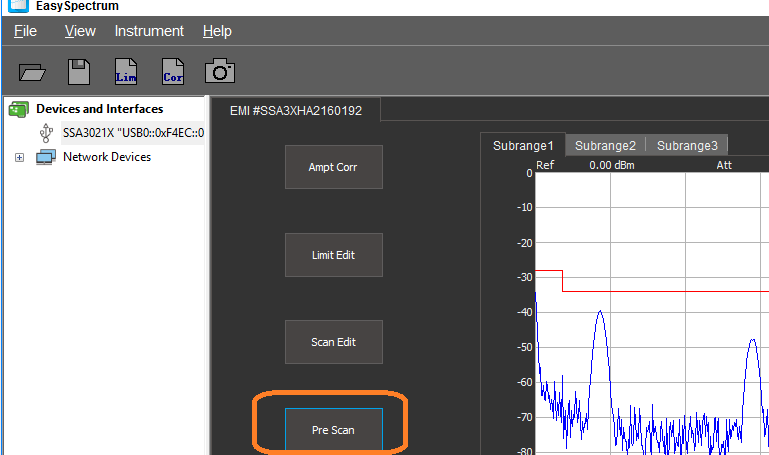
The figures below show a pre-scan configuration consisting of a single segment from 150 kHz to 30 MHz and the subsequent scan data:

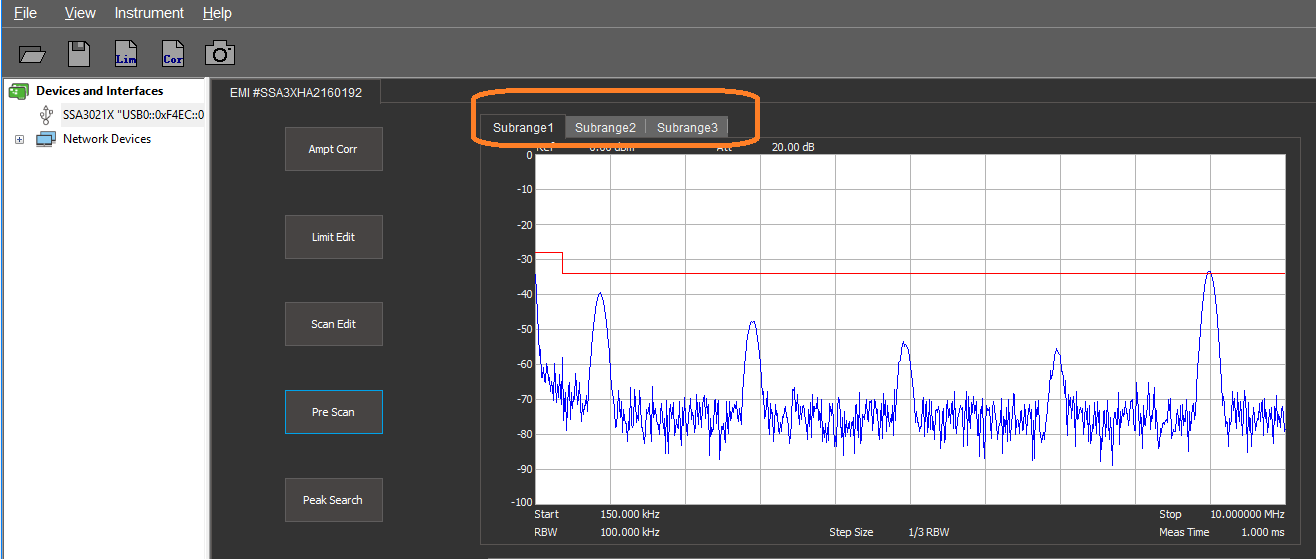
The figures below show the same span covered by three sub-range segments:
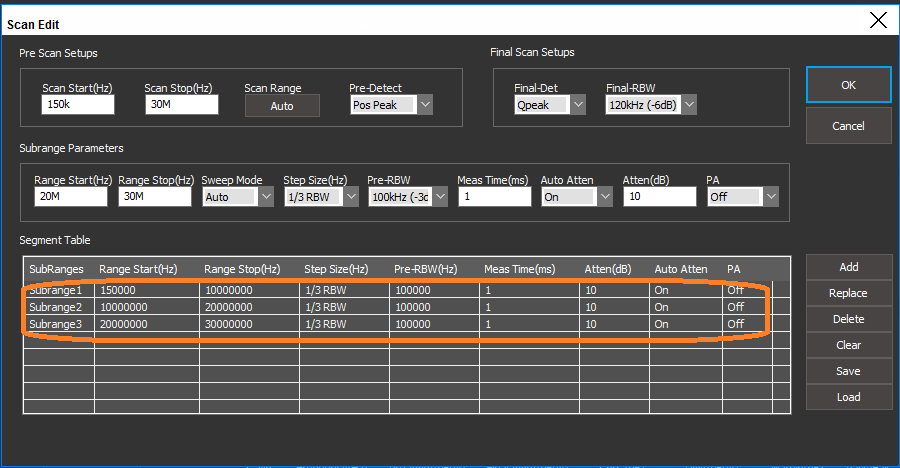
– Final Scan Setup:
NOTE: The QPeak (Quasi Peak) detector, 200 Hz / 9 kHz / 120 kHz RBW, and -6dB filter settings are only available on SSA3000X analyzers that have activated EMI options (Part number SSA3000X-EMI).
6. Initiates sequences defined by the Segment table data. You can access the scan data by pressing Scan Edit.
7. Peak Search: Define search parameters that identify peaks. Upon completion of the Peak Search peak definition, the software will perform a “Search” for peaks and fill the peak table with frequency and amplitude information for each peak identified.
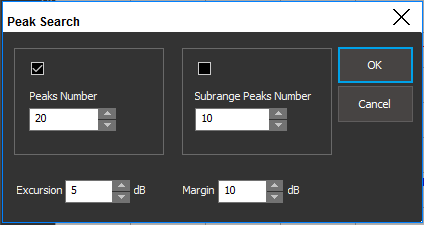
– Peaks Number: The maximum number of peaks to include in the peak list table
– Subrange Peaks Number: The maximum number of peaks to include from each subrange scan (if applicable)
– Excursion: Amplitude value (measured from the noise floor of the scan) that defines a peak. Amplitudes greater than the excursion value are placed into the peak table.
Items in the peak table are re-scanned using the Final Scan settings after pressing Final Scan.
– Margin (added in version 1.0.3.5): Defines peaks as signal elements that have amplitudes that are within the defined margin of the limit line. For example, a 10dB margin will define any signal with an amplitude that is within 10dB of the limit line as a peak and include it in the peak table.
8. Final Scan: Initiate sequences defined by the Final Scan Setups under the Scan Edit menu.

The Final Scan operations are applied to each peak in the peak table only. The SSA is placed into zero span mode centered on the peak frequency from the table and the scan commences.
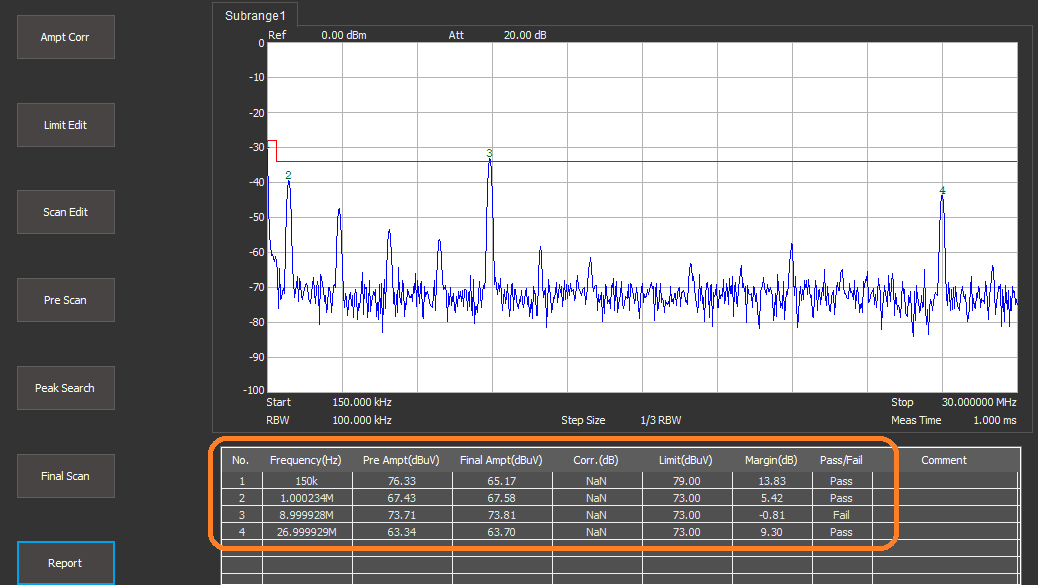
The peak table shows the frequency, pre-scan amplitude, final scan amplitude, the limit at that frequency, the margin between the peak and the limit, and the pass/fail of that peak based on final scan data.
NOTE: The QPeak (Quasi Peak) detector, 200 Hz / 9 kHz / 120 kHz RBW, and -6dB filter settings are only available on SSA3000X analyzers that have activated EMI options (Part number SSA3000X-EMI).
Quasi Peak detectors follow a defined response curve. Measurements made with the QPeak setting can take significantly longer than similar scans made with other detector types.
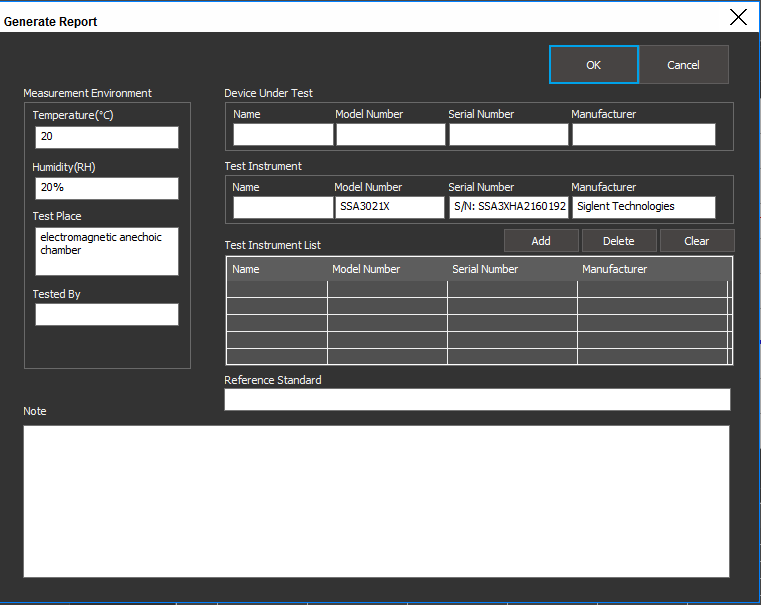
9. Report: After completing your initial scans, you can save the information by pressing the Report button. This provides a number of fields that can be filled in using information to help differentiate tests and keep track of important settings, etc.. You can save the report as an HTML document for easy viewing later.