How to Capture a Runt Pulse with a SIGLENT SDS Oscilloscope
December 27, 2017
Capturing a Runt Pulse
The new Super Phosphor Oscilloscope (SPO) technology supports deep memory, a fast waveform refresh rate and a 256 grey scale and color temperature waveform display. The intelligent Pass / Fail function is widely used in industrial electronic detection. The technology also includes powerful intelligent triggering (window, interval, timeout, pattern, Runt). Here we will demonstrate the runt triggering.
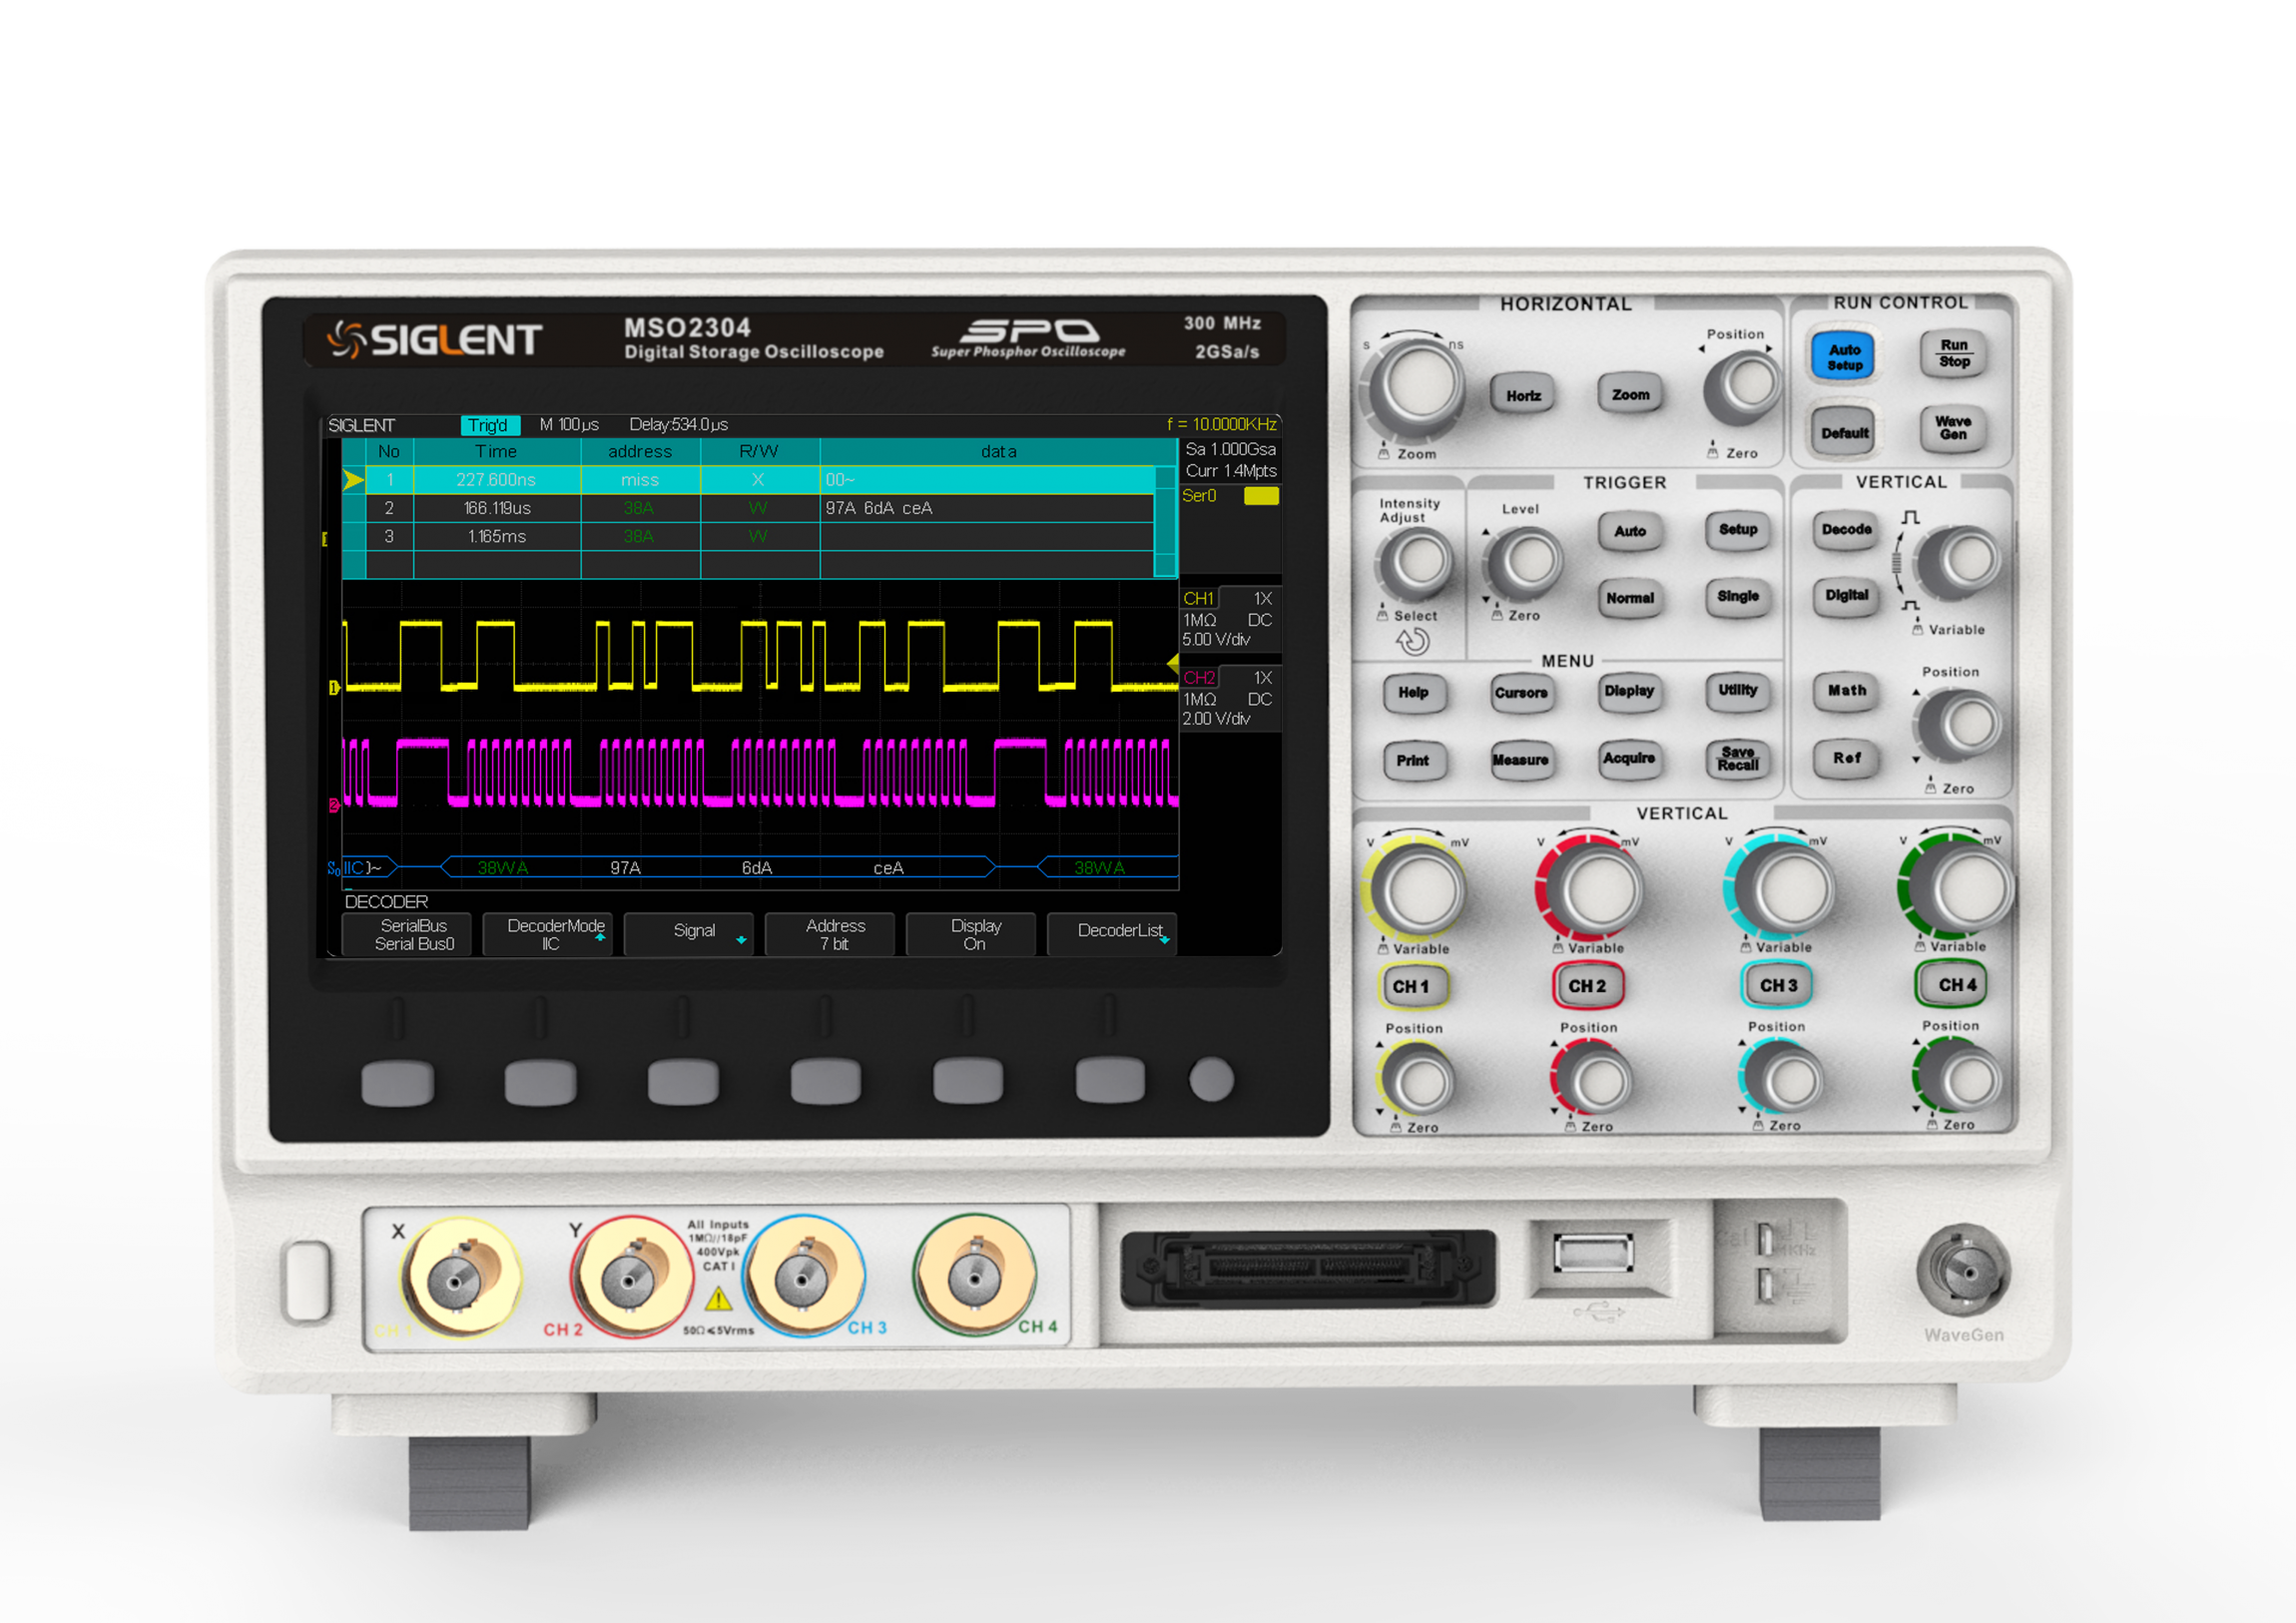
Figure 1: SIGLENT SDS2000 Series Oscilloscope.
First, we want to find out why the runt signal is occurring. Faulty circuits and other factors can generate runt pulses, so we need to analyze the captured waveform runts, and then explore the problems in our hardware circuits. To capture these runt signals we have to first understand what is triggering: The more classic understanding is to stabilize the displayed waveform which the oscilloscope user wants to see. Figure 1 is a faulty circuit board. Figure 2 shows an example of runt signal.
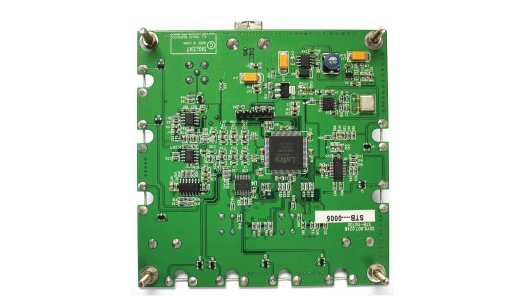
Figure 2: faulty circuit board
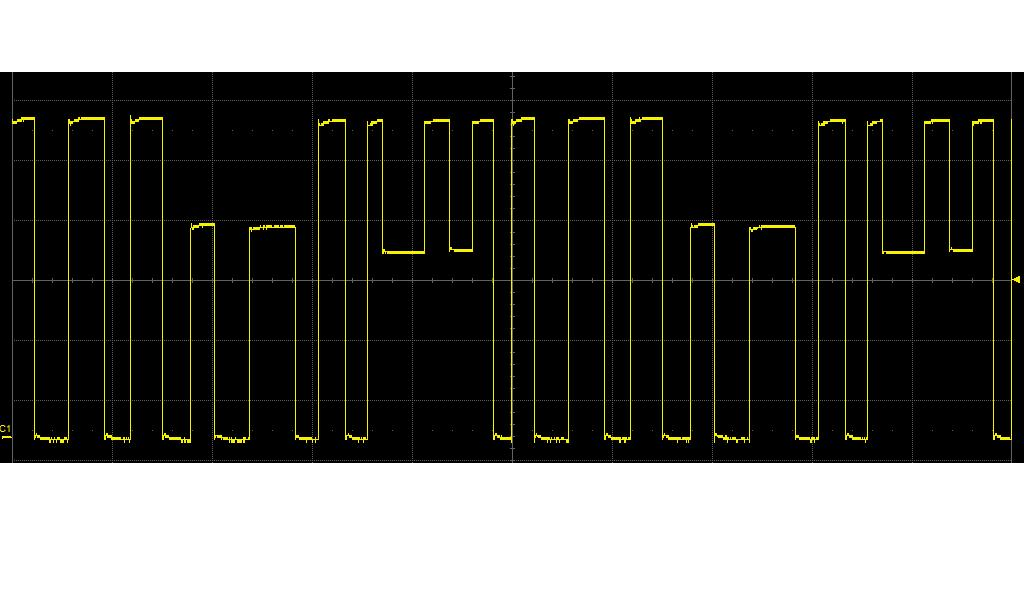
Figure 3: Runt pulse signal
Second, we need to understand what runt trigger is. While the width of the pulse sequence may be uncertain, the highest or lowest amplitude of the pulse signal is relatively consistent with other pulses in the data stream. However, there is a chance that the signal of interest might be best found using the runt triggering mode. When the pulse crosses the first threshold level within a certain timeframe but cannot cross the second threshold level, the oscilloscope is triggered. Shown in Figure 4:
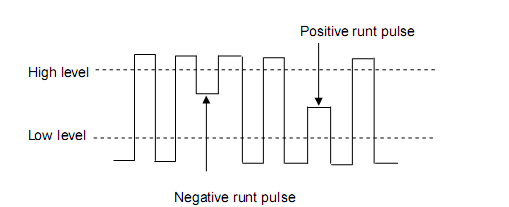
Figure 4: Runt Trigger
As can be seen from the above figure, to capture the waveform of interest we need to set:
1. Level (The runt pulse will occur between the lower and upper set point levels.)
2. Duration (How long must our runt appear before we wish to trigger on it)
We will now use the SDS2202 oscilloscope in the runt trigger mode to analyze the circuit board containing the runt signal using a stable waveform display on our oscilloscope.
Step 1
Pressing the AUTO button, The oscilloscope defaults to the edge-trigger mode. However, in many digital data streams there are multiple qualifying waveforms containing jitter, varying pulse widths, runts, and other instabilities. When triggering the scope repeatedly we can see that the displayed waveforms vary from one acquisition to the next (Figure 5).
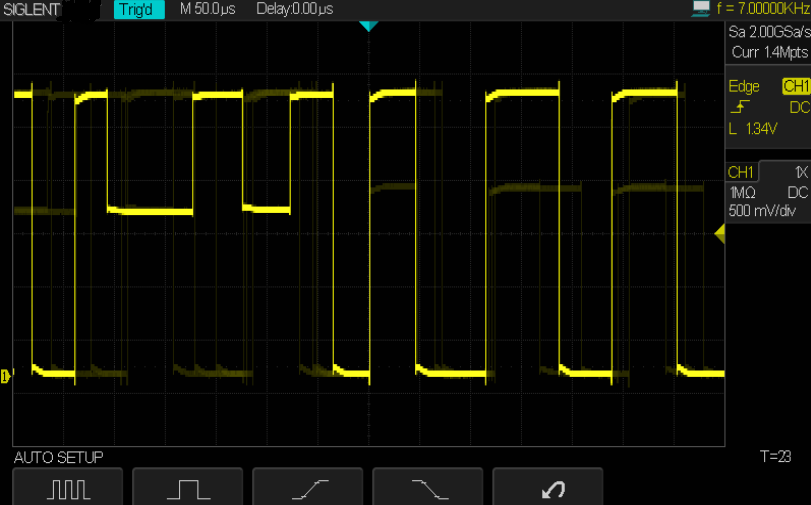
Figure 5: Unstable runt signal
Step 2
Press the SINGLE key to obtain a single trace acquisition. The waveform being displayed is stable. Press the CURSOR key and use the cursor knobs to measure positive runt pulse width and the runt pulse amplitude levels. In this example we see the runt’s pulse width is about 48us and the amplitude ranges from 1.37V to 1.94V (Figure 6).
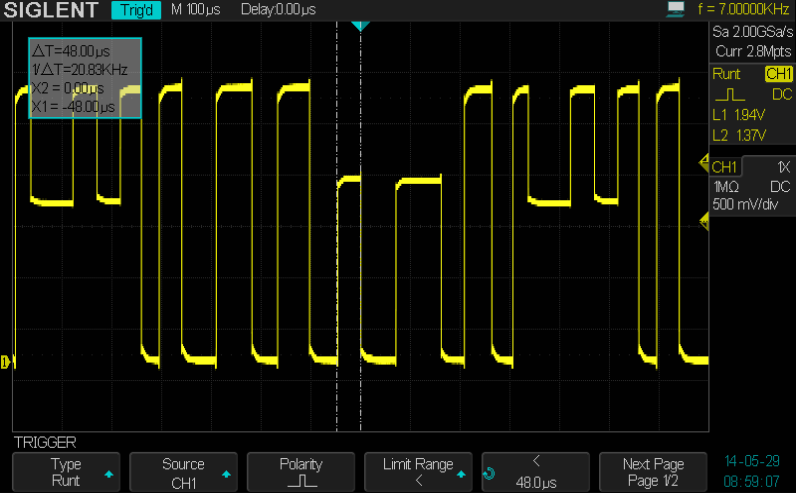
Figure 6: Using the cursor key to measure narrow pulse width
Step 3
After the measurement press RUN / STOP button to trigger the AUTO setting trigger conditions:
1. Choose runt trigger menu.
2. Source-select CH1, rising edge polarity selection, select less than the limiting conditions, (We now know that the isolated pulse width is less than the lower limit of the pulse, Note here is that the runt trigger of SDS2000 is like this, when you set the polarity to ‘positive’, it will trigger on the falling edge, while when you set the polarity to ‘negative’, it will trigger on the rising edge). The duration is set to 49 us, with a high level of 1.94 V and low of 1.37 V.
3. The signal is now stable, as shown in Figure 7.
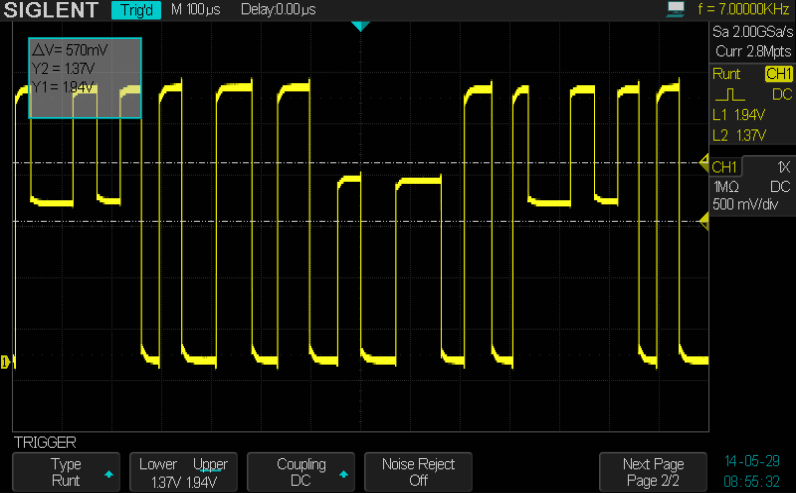
Figure 7: triggered runt pulses
Looking at our newly captured waveform, we can now analyze runt signal amplitude, period, rise time, and other parameters. This data can be used to help locate the problem in our circuit board.
In addition, the SDS2000 oscilloscope’s other triggering modes such as window, interval, timeout, serial triggering as well as the serial decode option are particularly effective tools for specific signal capture and analysis algorithms – a very powerful debugging tool for engineers.